Searchers type “black mold statistics” and get a species scare. The census is dumber and more useful: how many households report mold, how many report leaks, and which health associations actually have a committee behind them.
This hub is a housing-and-health ledger, not a lawsuit inventory. Occupant self-reports are not industrial-hygienist counts. Odds ratios are not verdicts. Mold Law King represents tenants and renters. Workplace and school studies appear only so you can see what the files are.
Every figure below is dated and linked to the origin. If a trail died at a roundup, it is not here.
Key Takeaways
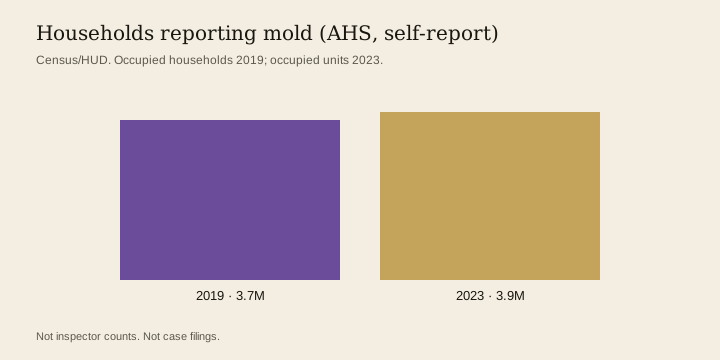
- Occupants of 3.9 million occupied U.S. housing units self-reported mold in the last 12 months in the 2023 American Housing Survey (Census/HUD, Sep 2024).
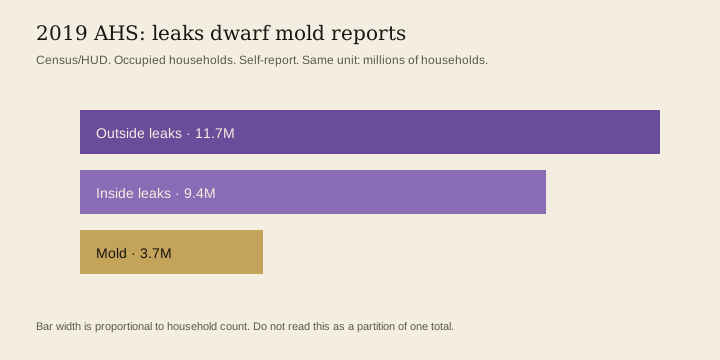
- Occupants of 3.7 million occupied U.S. households self-reported mold in the last 12 months in the 2019 American Housing Survey (Census/HUD, Jan 2021).
- Of 133.2 million occupied U.S. housing units in 2023, occupants self-reported housing-quality problems on the American Housing Survey (Census/HUD, Sep 2024).
- CDC states the most common indoor molds are Cladosporium, Penicillium, and Aspergillus (CDC, Sep 2024).
- CDC cites the 2004 Institute of Medicine finding of sufficient evidence linking indoor mold exposure with upper respiratory tract symptoms, cough, and wheeze in otherwise healthy people (CDC, Sep 2024).
- Mudarri and Fisk estimated that 21 percent (95 percent CI 12-29 percent) of U.S. current-asthma cases are attributable to dampness and mold exposure, if the association is causal (Indoor Air, Jun 2007).
- CDC reports 27,807,000 people in the United States had current asthma in 2023 (8.4 percent), based on NHIS (CDC, Jun 2026).
- EPA says that if the moldy area is less than about 10 square feet (roughly a 3-by-3-foot patch), in most cases a homeowner can handle cleanup following EPA guidelines (EPA, Feb 2026).
- CDC advises cleaning up and drying out a home fully and quickly within 24-48 hours after a flood (CDC, Sep 2024).
- Roof leaks were experienced by 4.4 percent of households in 2023 (HUD, Sep 2024).
- Mudarri and Fisk reported a population-weighted average prevalence of dampness or mold of 47 percent in U.S. housing from the studies they assembled (Indoor Air, Jun 2007).
- WHO estimates indoor dampness affects 10-50 percent of indoor environments in Europe, North America, Australia, India and Japan (WHO, Jan 2009).
How many U.S. households report mold?
The American Housing Survey is a household interview, not a swab. Treat the mold count as what occupants said, on a question that now asks about an area at least the size of a sheet of paper.
What did the 2023 survey actually ask?
- The 2023 American Housing Survey mold question asked whether, in the last 12 months, mold covered an area greater than or equal to an 8.5-by-11-inch piece of paper (Census/HUD, Sep 2024).
- American Housing Survey water-leakage data cover leaks in the 12 months prior to the interview, or while the household was living in the unit if occupancy was less than 12 months (Census/HUD, Sep 2024).
- The 2023 American Housing Survey release marked 50 years of AHS as a comprehensive assessment of U.S. housing (HUD, Sep 2024).
- HUD stated that all differences in the 2023 AHS release are statistically significant at the 90 percent confidence level (HUD, Sep 2024).
What else did those same 2023 interviews record?
Mold sits next to leaks, pests, and broken systems. Those are not “mold deaths.” They are the housing conditions that keep drywall wet.
- Occupants of 15.7 million occupied U.S. housing units self-reported seeing signs of mice or rats inside their home in the last 12 months in the 2023 American Housing Survey (Census/HUD, Sep 2024).
- Occupants of 13.2 million occupied U.S. housing units self-reported being uncomfortably hot for 24 hours or more in the 2023 American Housing Survey (Census/HUD, Sep 2024).
- Occupants of 7.2 million occupied U.S. housing units self-reported open cracks or holes inside their home in the 2023 American Housing Survey (Census/HUD, Sep 2024).
- Occupants of 3.7 million occupied U.S. housing units self-reported exposed wiring in the 2023 American Housing Survey (Census/HUD, Sep 2024).
- Occupants of 4.9 million occupied U.S. housing units self-reported foundation crumbling or open cracks or holes in the 2023 American Housing Survey (Census/HUD, Sep 2024).
- Occupants of 2.9 million occupied U.S. housing units self-reported broken plaster or peeling paint inside their home in the 2023 American Housing Survey (Census/HUD, Sep 2024).
- Occupants of 4.1 million occupied U.S. housing units self-reported a broken window in the 2023 American Housing Survey (Census/HUD, Sep 2024).
- Occupants of 2.3 million occupied U.S. housing units self-reported no working toilet at some point within the last 3 months in the 2023 American Housing Survey (Census/HUD, Sep 2024).
- Occupants of 11.8 million occupied U.S. housing units self-reported water leakage from outside their home in the 2023 American Housing Survey (Census/HUD, Sep 2024).
- Occupants of 11.2 million occupied U.S. housing units self-reported water leakage from inside their home in the 2023 American Housing Survey (Census/HUD, Sep 2024).
What did the 2019 survey show before the 2023 count?
Use 2019 as the last published infographic with a clean inside/outside leak split. Do not subtract it from 2023 and call the difference “new mold.”
- Of 124 million occupied U.S. households in the 2019 American Housing Survey, occupants self-reported a range of housing-quality problems (Census/HUD, Jan 2021).
- Occupants of 7.5 million occupied U.S. households self-reported being uncomfortably cold for at least 24 hours in the 2019 American Housing Survey (Census/HUD, Jan 2021).
- Occupants of 6.8 million occupied U.S. households self-reported open cracks or holes inside the home in the 2019 American Housing Survey (Census/HUD, Jan 2021).
- Occupants of 4.8 million occupied U.S. households self-reported foundation crumbling or an open crack or hole in the 2019 American Housing Survey (Census/HUD, Jan 2021).
- Occupants of 14.8 million occupied U.S. households self-reported seeing signs of mice or rats inside the home in the last 12 months in the 2019 American Housing Survey (Census/HUD, Jan 2021).
- Occupants of 14.0 million occupied U.S. households self-reported seeing signs of cockroaches inside the home in the last 12 months in the 2019 American Housing Survey (Census/HUD, Jan 2021).
- Occupants of 2.1 million occupied U.S. households self-reported no working toilet at some point within the last 3 months in the 2019 American Housing Survey (Census/HUD, Jan 2021).
- Occupants of 2.6 million occupied U.S. households self-reported broken plaster or peeling paint inside the home in the 2019 American Housing Survey (Census/HUD, Jan 2021).
- Occupants of 3.6 million occupied U.S. households self-reported a broken window in the 2019 American Housing Survey (Census/HUD, Jan 2021).
- Occupants of 11.7 million occupied U.S. households self-reported water leakage from outside the home in the 2019 American Housing Survey (Census/HUD, Jan 2021).
- Occupants of 9.4 million occupied U.S. households self-reported water leakage from inside the home in the 2019 American Housing Survey (Census/HUD, Jan 2021).
Did housing get drier over 50 years of AHS?
HUD’s 2023 release is a 50-year comparison. Roof leaks and heating breakdowns fell. That is not the same as “mold is over.”
What moved between 1973 and 2023?
- From 1973 to 2023, U.S. housing units nearly doubled from about 76 million homes to more than 145 million (HUD, Sep 2024).
- The share of housing units where the heating system broke down in the last winter was 8.3 percent in 1973 (HUD, Sep 2024).
- The share of housing units where the heating system broke down in the last winter was 2.7 percent in 2023 (HUD, Sep 2024).
- Roof leaks were experienced by 7.6 percent of households in 1973 (HUD, Sep 2024).
- The percentage of housing units with open cracks or holes in walls was 6 percent in 1973 (HUD, Sep 2024).
- The percentage of housing units with open cracks or holes in walls was 5.4 percent in 2023 (HUD, Sep 2024).
- Households reporting daily indoor tobacco-smoke exposure dropped from 8.1 percent in 2015 to 6.1 percent in 2023 (HUD, Sep 2024).
- The 2023 American Housing Survey includes similar statistics for 20 metropolitan areas and 11 states (HUD, Sep 2024).
Which molds actually grow indoors?
“Black mold” is the query. The common indoor list is not Stachybotrys.
What does CDC name as common, and what does it tell you to do?
- CDC advises keeping home humidity no higher than 50 percent all day long to help prevent mold growth (CDC, Sep 2024).
- CDC says mold can be removed from hard surfaces with a bleach solution of no more than 1 cup of household laundry bleach in 1 gallon of water (CDC, Sep 2024).
- CDC cites the 2009 World Health Organization Guidelines for Indoor Air Quality: Dampness and Mould (CDC, Sep 2024).
What do EPA’s cleanup rules actually say?
Moisture first. Sampling does not give you a federal “safe” number, because there isn’t one.
- EPA states it is important to dry water-damaged areas and items within 24-48 hours to prevent mold growth (EPA, Feb 2026).
- EPA advises keeping indoor humidity below 60 percent relative humidity, ideally between 30 and 50 percent (EPA, Feb 2026).
- EPA lists ten things to know about mold, including reducing indoor humidity to 30-60 percent to decrease mold growth (EPA, Sep 2026).
- EPA states that currently there are no EPA regulations or standards for airborne mold contaminants (EPA, Jun 2026).
- EPA states that since no EPA or other federal limits have been set for mold or mold spores, sampling cannot be used to check a building's compliance with federal mold standards (EPA, Sep 2026).
- EPA's Mold Remediation in Schools and Commercial Buildings guide is EPA 402-K-01-001, reprinted September 2008 (EPA, Feb 2026).
- EPA's mold-and-health page states it is important to dry water-damaged areas and items within 24-48 hours to prevent mold growth (EPA, Feb 2026).
What did IOM and WHO conclude about damp indoor spaces?
These are reviews of epidemiology, not tenant-law findings. They still beat a blog that copied a percentage.
What is the association, and what is not a threshold?
- IOM's 2004 review found sufficient evidence of an association between damp indoor environments and some upper respiratory tract symptoms, coughing, wheezing, and asthma symptoms in sensitized persons (IOM, Jan 2004).
- WHO states that no quantitative health-based guideline values or thresholds can be recommended for acceptable levels of contamination with microorganisms (WHO, Jan 2009).
- WHO reports that a 2004 review indicated at least 20 percent of buildings in several European countries, Canada and the United States had one or more signs of dampness (WHO, Jan 2009).
- WHO cites a study of 16,190 people in five Nordic countries with an overall indoor-dampness prevalence of 18 percent (WHO, Jan 2009).
- WHO cites Nordic dampness prevalence as low as 12.1 percent in Goteborg, Sweden, and as high as 31.6 percent in Tartu, Estonia (WHO, Jan 2009).
- WHO cites Mudarri and Fisk (2007) estimating the prevalence of dampness or mould in U.S. houses at approximately 50 percent (WHO, Jan 2009).
- WHO cites a U.K. study of 1,954 young mothers in which those in owner-occupied housing reported damp (52 percent) and mould (24 percent) (WHO, Jan 2009).
- WHO cites an eastern Germany study of 25,864 schoolchildren in which children of parents with low education were 4.8 times more likely to live in damp houses (WHO, Jan 2009).
- WHO cites Fisk, Lei-Gomez and Mendell (2007) on approximately 30-50 percent increases in respiratory and asthma-related health outcomes associated with dampness (WHO, Jan 2009).
How large is the asthma overlap?
Current-asthma counts come from NHIS. The 21% attributable figure is a 2007 estimate that is only as good as the causal assumption. Keep them in different sentences.
What does CDC count in 2023?
- CDC reports 4,804,000 U.S. children under 18 had current asthma in 2023 (6.7 percent), based on NHIS (CDC, Jun 2026).
- CDC reports 23,004,000 U.S. adults had current asthma in 2023 (8.9 percent), based on NHIS (CDC, Jun 2026).
- CDC reports current-asthma prevalence of 11.7 percent among people below 100 percent of the poverty threshold in 2023 NHIS, versus 6.9 percent at 450 percent of poverty or higher (CDC, Jun 2026).
- CDC reports 11,750,000 people with current asthma had one or more asthma attacks in the past 12 months in 2023 (42.3 percent) (CDC, Jun 2026).
- CDC reports 47.1 percent of children with current asthma had an asthma attack in the past 12 months in 2023, compared with 41.2 percent of adults (CDC, Jun 2026).
- CDC reports 3,624 U.S. asthma deaths in 2023, a crude death rate of 10.8 per million (CDC, Jun 2026).
- CDC reports 166 U.S. child asthma deaths in 2023 (2.3 per million) and 3,458 adult asthma deaths (13.2 per million) (CDC, Jun 2026).
- CDC reports non-Hispanic Black current-asthma prevalence of 11.5 percent in 2023 NHIS, compared with 8.6 percent among non-Hispanic White people (CDC, Jun 2026).
- CDC reports 2023 current-asthma prevalence of 9.9 percent among females and 7.0 percent among males (CDC, Jun 2026).
- CDC reports 16,488,000 females and 11,319,000 males had current asthma in 2023 (CDC, Jun 2026).
What did Mudarri and Fisk estimate if the association is causal?
- Mudarri and Fisk estimated that of 21.8 million people reported to have asthma in the U.S., approximately 4.6 million cases (2.7-6.3 million) are attributable to home dampness and mold exposure if causal (Indoor Air, Jun 2007).
- Mudarri and Fisk estimated the national annual cost of asthma attributable to home dampness and mold exposure at $3.5 billion ($2.1-$4.8 billion) in 2004 dollars, if causal (Indoor Air, Jun 2007).
- Mudarri and Fisk cited Fisk et al. (2007) odds ratio of 1.56 (95 percent CI 1.30-1.86) for current asthma in homes with dampness and mold (Indoor Air, Jun 2007).
- Mudarri and Fisk cited Fisk et al. (2007) estimates that dampness and mold raise risk for various adverse respiratory outcomes by 30-50 percent, based on a meta-analysis of 33 peer-reviewed studies (Indoor Air, Jun 2007).
- Mudarri and Fisk estimated total U.S. asthma cost in 2004 at approximately $17 billion a year (Indoor Air, Jun 2007).
- The Fisk et al. (2007) meta-analysis summarized by Mudarri and Fisk included 10 studies of current asthma (Indoor Air, Jun 2007).
- The Fisk et al. (2007) meta-analysis summarized by Mudarri and Fisk reported an odds ratio of 1.70 (1.44-2.00) for upper respiratory tract symptoms across 13 studies (Indoor Air, Jun 2007).
- The Fisk et al. (2007) meta-analysis summarized by Mudarri and Fisk reported an odds ratio of 1.67 (1.49-1.86) for cough across 18 studies (Indoor Air, Jun 2007).
- The Fisk et al. (2007) meta-analysis summarized by Mudarri and Fisk reported an odds ratio of 1.50 (1.38-1.64) for wheeze across 22 studies (Indoor Air, Jun 2007).
What did Mendell’s 2011 review add?
- Mendell et al. (2011) state that dampness and mold exposures in buildings are common, with estimates ranging from 18 percent to 50 percent of buildings (EHP, Jun 2011).
- Mendell et al. report that available quantitative meta-analyses estimated consistently increased risks for multiple outcomes associated with dampness or mold, including odds-ratio ranges of 1.30-1.75 (EHP, Jun 2011).
- Mendell et al. report that among 31 then-available studies, qualitative dampness-related factors were consistently associated with asthma exacerbation (EHP, Jun 2011).
- Mendell et al. report that in Kercsmar et al. (2006), acute-care visits 6-12 months after dampness-and-mold remediation were 90 percent fewer in remediated homes versus controls (p = 0.003) (EHP, Jun 2011).
- Mendell et al. report that dampness or mold was associated consistently with allergic rhinitis (92 percent of findings, all in children), with odds ratios ranging from 0.7 to 3.5 (EHP, Jun 2011).
- Mendell et al. report that 89 percent of odds ratios for eczema associated with dampness or mold were greater than 1.0 (range 0.2 to 2.9) (EHP, Jun 2011).
- Mendell et al. state that substantial increases in respiratory health outcomes, including a 50 percent increase in current asthma, are associated with dampness-related risk factors in residences (EHP, Jun 2011).
- Mendell et al. report 100 percent of findings in adult retrospective studies of asthma exacerbation had odds ratios from 1.7 to 2.6 (EHP, Jun 2011).
- Mendell et al. report 100 percent of findings in prospective studies of childhood asthma exacerbation had odds ratios from 3.8 to 7.6 (EHP, Jun 2011).
What about schools, offices, and NIOSH tools?
We do not take workplace mold cases. These numbers exist so a stats page does not pretend housing is the only damp-building literature.
What did NIOSH measure in buildings?
- NIOSH says appropriate remediation includes drying wetted materials within 48 hours of getting wet or removing the materials (NIOSH, Feb 2025).
- NIOSH published the Dampness and Mold Assessment Tool on its website in December 2018 (NIOSH, Jul 2022).
- Park and Cox-Ganser report that a 2019 American Housing Survey indicated 9.4 percent of U.S. homes had exterior water leakage (NIOSH, Jul 2022).
- Park and Cox-Ganser report that a 2019 American Housing Survey indicated 7.6 percent of U.S. homes had interior water leakage (NIOSH, Jul 2022).
- Park and Cox-Ganser cite a study of 831 U.S. residential homes in which 24 percent had moisture or mold problems (NIOSH, Jul 2022).
- Park and Cox-Ganser report a population-weighted average prevalence of dampness/mold from published U.S. studies of 47 percent (NIOSH, Jul 2022).
- Park and Cox-Ganser state indoor dampness/mold prevalence varies widely from 10-50 percent depending on continent, country, and region (NIOSH, Jul 2022).
- Park and Cox-Ganser cite estimates that about 15 percent of new childhood asthma in Europe is attributable to home dampness/mold (NIOSH, Jul 2022).
- Park and Cox-Ganser cite the EPA BASE study of 100 U.S. office buildings in which 85 percent experienced past water damage (NIOSH, Jul 2022).
- Park and Cox-Ganser cite the EPA BASE study of 100 U.S. office buildings in which 45 percent had current leakage problems (NIOSH, Jul 2022).
What do the four licensed states show on asthma?
These are asthma prevalence tables, not mold-claim counts. They sit here because the practice is AZ, CA, CO, and KS — and because a national asthma file without the four states is a dodge.
Children (NSCH 2023)
- CDC reports 122,912 Arizona children had current asthma in 2023 (7.9 percent), from the National Survey of Children's Health (CDC, Jun 2026).
- CDC reports 548,709 California children had current asthma in 2023 (6.5 percent), from NSCH (CDC, Jun 2026).
- CDC reports 82,728 Colorado children had current asthma in 2023 (6.9 percent), from NSCH (CDC, Jun 2026).
- CDC reports 45,587 Kansas children had current asthma in 2023 (6.7 percent), from NSCH (CDC, Jun 2026).
Adults (BRFSS 2023)
- CDC reports 601,018 Arizona adults had current asthma in 2023 (10.3 percent), from BRFSS (CDC, Jun 2026).
- CDC reports 2,688,439 California adults had current asthma in 2023 (8.8 percent), from BRFSS (CDC, Jun 2026).
- CDC reports 524,666 Colorado adults had current asthma in 2023 (11.3 percent), from BRFSS (CDC, Jun 2026).
- CDC reports 221,805 Kansas adults had current asthma in 2023 (9.9 percent), from BRFSS (CDC, Jun 2026).
California Breathing (CDPH)
- California Breathing reports that 1 in 7 Californians have asthma (CDPH, May 2026).
- California Breathing reports that asthma causes 145,000 emergency-room visits in California each year (CDPH, May 2026).
- California Breathing reports that asthma causes 15,000 hospital stays in California each year (CDPH, May 2026).
- California Breathing reports 364 asthma deaths in California each year (CDPH, May 2026).
- California Breathing reports that asthma causes 1 in 3 children with asthma in California to miss school each year (CDPH, May 2026).
- California Breathing reports that asthma causes 1 in 5 adults with asthma in California to miss work each year (CDPH, May 2026).
- California Breathing reports that asthma costs $14.5 billion per year in California, including medical expenses, premature deaths, and missed school and work days (CDPH, May 2026).
What these files are not
They are not settlements, verdicts, or “average mold case value.” They are not Colorado crash census (that lives on the parent firm). They are not a reason to title a lawyer page “mold remediation.” If you are a renter with a documented leak and an unfixed unit, the next step is a qualifier, not a spore count.
Tenants in Arizona, California, Colorado, or Kansas can check if they qualify. We do not take homeowner or workplace files.
Methodology and Sources
Stats were selected only when the origin page or report still carries the number. Aggregators and law-firm roundups were dropped. AHS figures are occupant self-reports. Asthma attributable fractions from 2007 are labeled as estimates that assume causality. This page is refreshed monthly. The visible stamp moves only when a new verified stat is added.